
Controller Accelerometer Test
Check whether your controller’s accelerometer data is exposed in the browser. This page runs a Gamepad API-based accelerometer support diagnostic and shows live controller input.
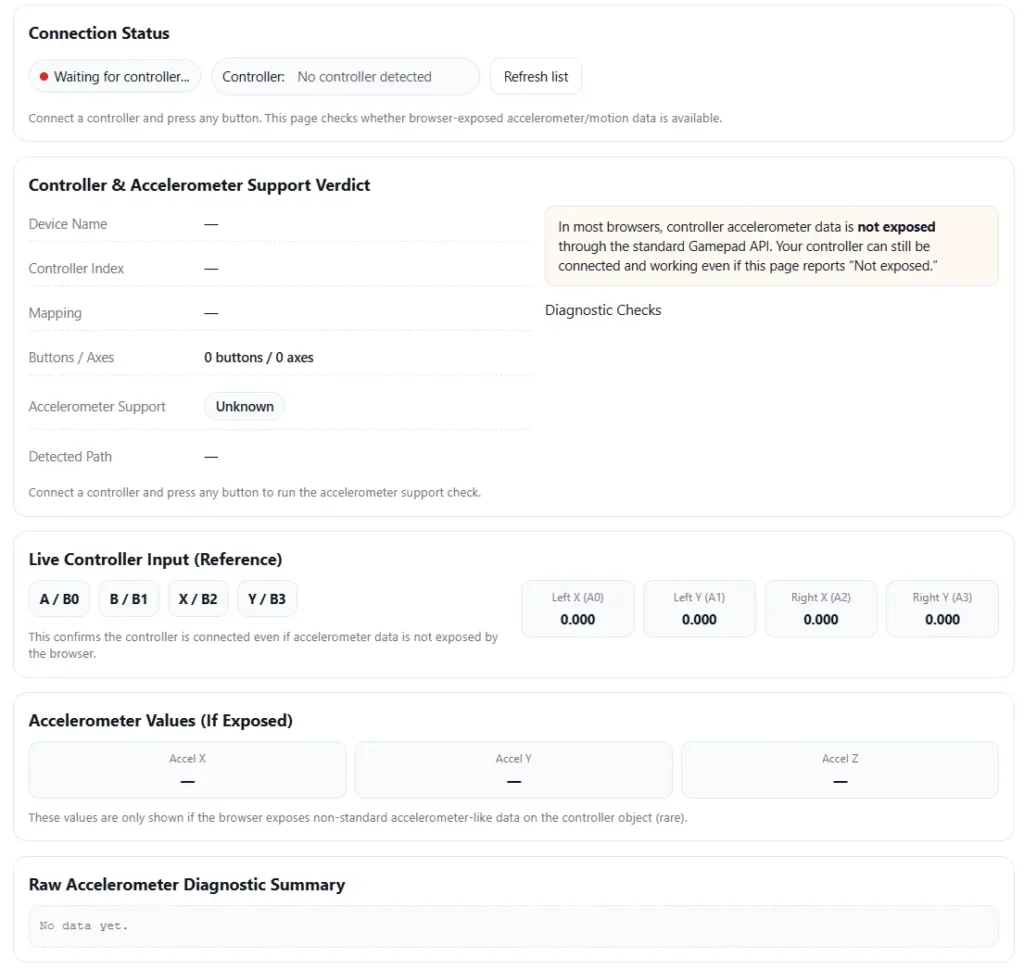
Connection Status
Connect a controller and press any button. This page checks whether browser-exposed accelerometer/motion data is available.
Controller & Accelerometer Support Verdict
Connect a controller and press any button to run the accelerometer support check.
Live Controller Input (Reference)
This confirms the controller is connected even if accelerometer data is not exposed by the browser.
Accelerometer Values (If Exposed)
These values are only shown if the browser exposes non-standard accelerometer-like data on the controller object (rare).
Raw Accelerometer Diagnostic Summary
No data yet.
I see people get confused by this term a lot. An accelerometer test controller is simply the system that runs and manages an accelerometer test. It controls the vibration input, collects sensor data, and helps check if the sensor behaves correctly.
In most setups, the controller connects several tools into one measurement chain. This chain handles motion input, sensor power, signal reading, and test automation. Some labs run these tests on shaker tables. Production lines may run faster automated checks. Field teams sometimes run quick verification tests outside the lab.
A typical system includes DAQ hardware, signal conditioning, control software, and reporting tools. Together they handle the full calibration workflow from stimulus to results.
Main Functions of an Accelerometer Test Controller
- Vibration controller manages shaker motion or other test stimulus
- Signal conditioning powers sensors and prepares signals for measurement
- DAQ system captures sensor output during the test
- Synchronized acquisition keeps vibration input and sensor data aligned
- Test automation runs repeatable test sequences
- Calibration workflow tools analyze results and generate reports
Simple Test Chain Example
sensor → signal conditioning → ADC / DAQ → software analysis → test report
Where Accelerometer Test Controllers Get Used in Real Testing
I’ve seen these systems used in many places. Different teams test accelerometers for different reasons. And each use case needs slightly different controller features.
Here are some common places where an accelerometer test controller shows up.
• R&D characterization
Engineers study how a sensor behaves across motion and frequency ranges. These tests often use a shaker table test setup.
Capabilities map
characterization → flexible control, detailed logging, advanced analysis
• Production end-of-line test
Factories run a quick end-of-line test before shipping devices. The goal is speed and consistency.
Capabilities map
end-of-line test → high throughput, automation, simple pass or fail logic
• Incoming inspection
Companies test sensors from suppliers before using them. This works like an acceptance test for quality checks.
Capabilities map
acceptance test → repeatable workflow, clear reporting, traceability
• Failure analysis
When a sensor behaves strangely, engineers reproduce the problem in a controlled setup.
Capabilities map
failure analysis → flexible test control, raw data access
• Compliance or qualification testing
Products must pass vibration and environmental testing before release.
Capabilities map
qualification → documented procedures, traceable results
• Field diagnostics
Technicians verify sensor health during maintenance.
Capabilities map
field test → portable tools, quick verification
For motion systems that combine sensors, teams sometimes also run gyro test controller workflows. Lab quality practices often follow guidance from ISO/IEC 17025 laboratory standards.
Main Parts of the Accelerometer Test Setup (Measurement Chain)
I’ve seen people blame the sensor when data looks wrong. But most of the time the problem sits somewhere in the measurement chain.
An accelerometer test setup includes several parts. The sensor, mounting method, signal conditioning, data capture, and analysis software all work together. If one piece fails, the whole test result becomes unreliable.
So when someone runs a test, they really test the full chain. Mounting, conditioning, sampling, and analysis all affect accuracy.
Quick Sanity Checklist Before Running a Test
• Sensor mounted tightly on the fixture
• Cable secured to avoid cable motion
• Correct input type selected for IEPE or voltage sensor
• Grounding checked to avoid electrical noise
• Sample rate configured correctly
• Anti-aliasing filter enabled
• No signal clipping or saturation
Sensor Types You Might Be Testing (MEMS vs Piezo or IEPE)
Most labs test two common accelerometer families.
MEMS accelerometer
• Uses micro mechanical structures to detect motion
• Often runs on stable DC power
• Can output digital or analog signals
• May show small bias drift over time
• Sensitivity and scale factor depend on internal electronics
Selection implications for the controller
• Must support stable power supply
• Must handle voltage or digital interface signals
• Needs flexible sampling and filtering
IEPE or piezoelectric accelerometer
• Uses a piezoelectric crystal to generate voltage from vibration
• Requires IEPE constant current excitation
• Usually offers strong high frequency response
• Often used in shaker table vibration testing
Selection implications for the controller
• Controller must provide IEPE excitation
• Must support wide dynamic range
• Must handle high bandwidth signals
Signal Conditioning (IEPE, Charge, Voltage, Filtering)
Signal conditioning prepares the sensor signal before measurement. Without it, noise and offsets can distort the data.
A system may use IEPE inputs or a charge amplifier depending on the sensor type. Filters help remove unwanted frequencies and protect the ADC input from overload.
Common best practices
Do
• Use correct IEPE current settings
• Apply a high-pass filter to remove slow drift
• Use a low-pass filter to protect bandwidth
• Monitor signal levels to avoid saturation
Do not
• Ignore filter settings during calibration workflow
• Run signals close to clipping levels
• Mix incorrect sensor input types
Common symptoms and likely cause
• drifting baseline → incorrect bias or grounding
• 50 or 60 Hz hum → poor grounding or shielding
• signal clipping → dynamic range too small
More details appear in these signal conditioning fundamentals.
DAQ and Sampling (Sample Rate, Anti Aliasing, Time Sync)
The DAQ system captures the sensor output and converts it with an ADC. Sampling settings strongly affect data quality.
I usually set the sampling rate based on the highest vibration frequency expected in the test. The system also uses an anti-aliasing filter so high frequency signals do not appear as false low frequency peaks.
Simple workflow
- Select the correct sampling rate for the test
- Enable anti alias filtering
- Start synchronized recording for all channels
- Verify signals before running full vibration
If you see mirrored peaks in the FFT, aliasing may be happening. Lower the bandwidth or adjust filters.
Mechanical Mounting and Fixtures (Where Many Errors Start)
Honestly, mounting causes a lot of bad test results.
A loose sensor or weak fixture can create mounting resonance. That resonance changes the vibration seen by the accelerometer.
Common mounting methods
• Stud mount
Best for rigid connections and repeatable measurements
• Adhesive mount
Useful for quick tests but may reduce high frequency response
• Magnetic mount
Fast setup but limited stability at higher vibration levels
Mounting checklist
• Apply correct mounting torque
• Use a stiff adapter or fixture surface
• Secure cables to prevent cable motion
• Avoid flexible plates that amplify vibration
Simple decision guide
stud mount → precision lab tests
adhesive mount → quick evaluation tests
magnetic mount → temporary field checks
Detailed guidance appears in these accelerometer mounting best practices.
What to Measure in an Accelerometer Test (Core Parameters and Pass Rules)
I’ve seen people run vibration tests but forget what they are actually checking. A good accelerometer test controller does not just collect data. It checks if the sensor meets defined acceptance rules.
Most labs measure a few core parameters. These values show how the sensor reacts to motion and whether the results stay stable during testing.
Below is a simple overview of the most common metrics.
| Metric | Test Method | Common Pitfalls |
| sensitivity / scale factor | compare DUT output to reference accelerometer | incorrect mounting or wrong filter |
| frequency response | run sine sweep or random vibration test | fixture resonance creating false peaks |
| noise floor | capture stationary signal and calculate RMS noise | electrical noise or cable motion |
| bias stability | measure mean offset over time | temperature change or warm up drift |
| cross axis sensitivity | excite one axis and monitor others | sensor misalignment |
| linearity | apply increasing vibration levels | signal clipping or saturation |
| saturation behavior | push signal near range limit | ADC overload or dynamic range issue |
Some labs also combine these tests with a vibration strength testing controller.
Sensitivity and Scale Factor Verification
Sensitivity tells how much signal the accelerometer produces for a given vibration level. Engineers compare the DUT with a reference accelerometer to calculate the scale factor.
Basic workflow
- Mount the DUT and reference sensor on the same fixture
- Apply a known vibration input
- Record output signals from both sensors
- Compare amplitude at the calibration point
- Calculate the scale factor difference
Important conditions must stay documented during the test.
Minimum documentation list
• reference sensor ID
• mounting method and torque
• temperature during the test
• filter settings and bandwidth
• sampling setup and controller configuration
Frequency Response (Sine Sweep and Random Vibration)
Frequency response shows how the sensor behaves across vibration frequencies. Engineers often run a sine sweep or random vibration profile to measure the transfer function.
What good data looks like
• smooth response curve
• predictable sensitivity across the range
• repeatable measurements across multiple runs
What bad data may show
• sharp resonance peak from the fixture
• sudden drop caused by poor mounting
• unstable response due to cable motion
Engineers usually review graphs on log or linear axes. Both views help reveal different patterns in the response.
Noise, Bias, and Drift (Stability Tests)
A stability test measures sensor behavior when no vibration is present. The accelerometer stays still while the controller records output data.
Basic stability test steps
- Place the sensor on a stable surface
- Start recording data with the accelerometer idle
- Capture signal for several minutes
- Calculate noise and offset statistics
Common outputs engineers report
| Output | Meaning |
| RMS noise | average signal noise level |
| mean bias | constant offset when sensor is still |
| drift trend | change in offset over time |
Some teams also analyze Allan variance to understand long term stability.
I usually review both views of the data. Time domain results show offset changes. Frequency domain plots reveal the true noise floor. Together they give a clearer picture of sensor stability.
How to Pick the Right Accelerometer Test Controller (Selection Checklist)
I’ve seen teams buy the wrong system just because it looked powerful. But the right accelerometer test controller depends on what you actually test.
Some labs run complex vibration studies. Others just run a quick end-of-line check. The controller should match the job.
Here are the main things I usually check first.
Basic Selection Checklist
• Channel count
How many sensors will you test at once
• Input type support
Check if the controller supports IEPE input, charge sensors, or voltage outputs
• Bandwidth capability
The system must capture the highest vibration frequency you expect
• Sample rate capability
The controller must support accurate sampling and synchronization
• Signal synchronization
Multi sensor tests need time aligned signals
• Automation software
Automated test runs reduce human mistakes
• Report generation
The system should create repeatable test reports
• API integration
Some labs connect controllers to scripts or automation systems
• Safety limits
Systems should detect overloads and prevent signal damage
• Calibration support
The controller should fit your traceability workflow
For a broader overview of test automation solutions, some platforms show integrated testing setups here.
Instrumentation studies and measurement methods also appear in engineering research databases.
Simple Requirements Map
| Requirement | Priority |
| correct input type support | Must |
| stable sampling and bandwidth | Must |
| synchronized channels | Must |
| automation software | Should |
| report generation | Should |
| API integration | Nice |
| advanced analysis tools | Nice |
Buy vs Build Approach
This decision comes up a lot.
Integrated controller systems combine DAQ, conditioning, and software in one unit. They are easier to deploy and support pass/fail testing.
A modular setup uses separate DAQ hardware and custom scripts. Engineers sometimes prefer this when they need flexible research tools.
Quick comparison
Integrated controller
• easier setup
• stable calibration workflow
• better for production tests
Modular DAQ system
• flexible analysis
• custom data processing
• better for experimental research
Software Capabilities That Matter (Automation and Reporting)
Honestly, software makes a huge difference in testing. Even a good measurement system becomes hard to use without proper automation.
Features that reduce errors
• test sequencing for repeatable workflows
• locked parameters to avoid accidental changes
• automatic plots during test runs
• structured data logging
• export formats for reports and analysis
• API support for automation or scripting
Many controllers allow scripting through common environments such as Python or LabVIEW. Labs use these tools to connect test stations with databases or manufacturing systems.
Typical automation workflow
- Load a saved test template
- Run the automated sequence
- Capture vibration and sensor data
- Generate plots and statistics
- produce a report template with results
Minimum Viable Test Report
A simple report should include
• sensor ID or serial number
• test date and station ID
• calibration settings
• frequency response or calibration curve
• summary statistics
• final pass/fail result
An audit trail also helps track who ran the test and which settings were used.
Production vs R&D Needs (Speed vs Flexibility)
Not every lab runs tests the same way. Production lines and research labs usually want different features.
| Feature | Production Testing | R&D Testing |
| testing goal | fast validation | detailed characterization |
| workflow | fixed recipe | flexible setup |
| data access | limited summary | full raw data |
| automation | high | moderate |
| analysis tools | basic pass fail | advanced processing |
| traceability | strict documentation | experimental freedom |
Production environments usually run automated end-of-line tests. The system loads a fixed recipe and produces a quick pass or fail result.
Research labs need more flexibility. Engineers often adjust test parameters, analyze raw signals, and compare multiple experiments.
One useful trick many labs use is a golden unit. This reference sensor runs periodic tests to detect drift in the measurement system. If results change, the test station may need recalibration.
Because of that, good controller software also supports regression testing and long term data comparison.
Troubleshooting Common Accelerometer Test Problems (Symptoms and Fixes)
I’ve seen many accelerometer tests look wrong at first. Most of the time the sensor is not the problem. Something in the setup causes the bad data.
A good troubleshooting approach starts with the symptom. Then check the most likely cause in the measurement chain.
Below are the issues engineers usually see during vibration testing.
| Symptom | Likely Cause | Fix |
| unexpected peaks in frequency graph | fixture resonance or weak mounting | tighten mount, check fixture stiffness |
| sensitivity much lower than expected | incorrect mounting or wrong measurement range | remount sensor, verify input range |
| noisy signal across the graph | poor grounding, EMI, or cable motion | secure cable, check shielding and grounding |
| signal drifting slowly over time | temperature change or sensor warm up | allow warm up period before testing |
| mirrored frequency peaks in FFT | aliasing from low sampling setup | increase sampling rate or enable anti alias filter |
| flat topped waveform | clipping or saturation in the ADC | reduce gain or increase dynamic range |
| channels showing delayed signals | channel skew or timing mismatch | verify synchronization settings |
| unstable vibration levels | loose mounting or unstable shaker | check fixture and mounting torque |
These problems appear frequently during shaker table tests. Many of them connect directly to vibration setup issues.
Notes on the Most Common Problems
Fixture resonance
A weak or flexible fixture can amplify vibration at certain frequencies. The accelerometer then shows peaks that do not belong to the sensor.
Simple checks
• verify fixture stiffness
• shorten adapter stack height
• retighten mounting torque
Low sensitivity readings
Sometimes the accelerometer output looks smaller than expected. This usually happens when the sensor is not mounted correctly.
Quick checks
• confirm mounting surface is clean
• verify correct input range
• ensure the sensor axis aligns with vibration direction
Noisy measurement signal
Noise can come from electrical interference or mechanical cable movement.
Common sources
• poor grounding
• nearby electrical equipment causing EMI
• cable motion transferring vibration to the sensor
Simple fix
Secure cables with strain relief and verify shield connections.
Signal drift during long tests
Slow drift usually appears during long measurements. Temperature changes and sensor warm up often cause this behavior.
Quick solution
Allow the sensor and electronics to stabilize before starting the measurement.
Aliasing artifacts
If the sampling rate is too low, the system can misinterpret high frequency signals. The graph may show mirrored peaks or strange patterns.
Fix
• increase sampling rate
• confirm the anti alias filter is active
Signal clipping
Clipping occurs when the signal exceeds the ADC range. The waveform appears flat at the top.
Fix
• reduce gain settings
• increase measurement range
Repeated clipping also damages data accuracy.
Stop the Test If You See These Warning Signs
Sometimes it is better to stop the run and fix the setup first.
Stop the test if
• repeated clipping appears in the waveform
• mounting becomes loose during vibration
• signal noise suddenly increases
• large unexpected resonance peaks appear
• channels lose synchronization
These issues often indicate setup problems that will invalidate the results. Fix the cause first before running the test again.
Related Controllers in the Test Ecosystem (Other Tests You May Need)
I’ve noticed something in many hardware labs. Teams start with one sensor test. Later they realize the product needs more checks.
An accelerometer test controller often sits inside a larger test system. Devices today combine sensors, inputs, and interfaces. That means testing one component may not be enough for full test coverage.
Many modern products include an IMU. An IMU combines an accelerometer with a gyroscope. Some devices also include touch interfaces that require their own tests.
Because of that, engineers sometimes expand their setup with related controllers.
Gyro Controller for IMU Testing
Some systems measure both motion and rotation. That means the accelerometer test alone cannot verify the full IMU testing workflow.
A gyro controller helps validate rotation behavior.
When to add this test
• device uses a combined IMU sensor
• motion tracking depends on rotation data
• engineers must compare accel and gyro outputs
• system requires synchronized multi sensor validation
Touchpad Test Controller for Interface QA
Some devices also include user input surfaces like touchpads. These require their own validation process.
A touchpad test controller checks surface input accuracy and gesture response.
When to add this test
• the device includes a touchpad or gesture surface
• user interface behavior must be verified
• manufacturing requires automated input tests
• QA teams validate touch performance
Here is a simple example of a touchpad test controller for interface QA.
Why These Controllers Work Together
Many test labs combine these controllers into one workflow. Motion sensors verify physical movement. Interface tests verify user interaction.
Together they improve test coverage across the full product system.
And honestly, this approach catches problems earlier before devices reach production.
Forum Insights: Common Mistakes Practitioners Often Make
I read a lot of lab discussions and engineer forums. The same common mistakes show up again and again during accelerometer testing.
These issues usually come from setup problems, not bad sensors.
Here are some commonly reported issues and simple best practices to avoid them.
• Mistake: assuming a sensor defect when a large peak appears
Best practice: check the fixture first. Resonance from the mount often causes those peaks.
• Mistake: ignoring cable movement
Best practice: secure cables and avoid loose routing. Cable motion adds vibration noise.
• Mistake: using heavy filtering to clean noisy data
Best practice: fix the noise source instead of hiding it with filters.
• Mistake: not documenting test settings
Best practice: always record sampling setup, filters, mounting method, and calibration workflow.
• Mistake: skipping a reference or golden sensor
Best practice: use a reference unit to verify system stability.
• Mistake: ignoring temperature and environment changes
Best practice: allow warm up time and keep conditions consistent.
One practical tip from field experience: keep a lab checklist and track recipe versions just like software updates. That small habit makes troubleshooting much easier later.
Conclusion: Building a Reliable Accelerometer Test Workflow
I’ve seen good sensors fail tests just because the setup was messy. Reliable testing really depends on the full measurement chain. Mounting, signal conditioning, sampling, and analysis all need to work together.
Clear procedures improve repeatability and help teams trust the results. Good documentation also supports traceability, which becomes important during audits or production checks. And honestly, the right controller selection makes the whole workflow easier.
Frequently Asked Questions (FAQ)
What does an accelerometer test controller do in a vibration test setup?
An accelerometer test controller manages the full vibration test process. It controls the vibration input, runs the control loop, and handles data acquisition from the sensor. The system then analyzes the signal and supports performance verification. Typical outputs include frequency response graphs, sensitivity results, and pass or fail test reports.
How do I choose between a shaker controller and a DAQ based controller for accelerometer testing?
Choose based on the test goal.
Shaker controller
Use this if you need precise vibration control and predefined test profiles.
DAQ system
Choose this when you need flexible automation, custom analysis, or multiple sensor inputs.
Many labs combine both for full measurement and control.
What are the most important specs for an accelerometer test controller?
Key specifications usually include:
supported input type such as IEPE or voltage
number of measurement channels
signal bandwidth capability
supported sample rate
available filtering options
channel synchronization
dynamic range support
software automation and reporting tools
Why does my accelerometer frequency response show unexpected peaks?
Unexpected peaks usually come from the setup, not the sensor.
Common causes
resonance from the mounting fixture
loose sensor mounting
cable motion during vibration
aliasing from poor sampling setup
signal clipping or saturation
Check mounting and sampling settings first.
Do I need traceable calibration for production testing?
Sometimes yes. It depends on industry requirements and customer rules.
Many regulated industries require traceability through calibration standards like ISO/IEC 17025. Other environments use internal verification with reference sensors.
Minimum best practice
document the calibration workflow
maintain reference sensors
record test conditions
How can I reduce noise in accelerometer test measurements?
Follow these practical steps.
Secure cables with proper cable strain relief.
Check grounding and shielding to reduce EMI.
Mount the sensor firmly to avoid vibration artifacts.
Verify signal conditioning and filter settings.
Record baseline data to confirm the true noise floor.