
Switch Pro Controller Test
Test your Nintendo Switch Pro Controller online with live button, trigger, D-pad, and analog stick input detection in the browser.
Connection Status
Connect your Switch Pro Controller and press A/B, ZL/ZR, or a D-pad button to begin the test.
Controller Info
Connect a Nintendo Switch Pro Controller (USB or Bluetooth) and press any button to start.
Quick Test Tips
This tool tests browser Gamepad API input detection. Home/Capture buttons and exact face-button labels may differ depending on browser mapping.
Switch Pro Controller Input Test
Buttons & D-pad
ZL / ZR & Sticks
Nintendo controller mappings can vary in browsers. If face buttons seem swapped, the browser/driver may be reporting Xbox-style logical positions instead of Nintendo-labeled positions.
I tested a Nintendo Switch Pro Controller to see how it handles input lag, latency, dead zone behavior, and early signs of stick drift. I ran tests on Bluetooth and USB C cable modes. I also checked polling rate and jitter because they change how fast inputs reach the game. These results come from one tested unit using measured tools and repeat runs. Later in this page, I share the raw data format and schema so anyone can repeat the test and compare results.
Main Test Takeaways from This Dataset
I ran several checks on this Nintendo Switch Pro Controller. And a few things stood out right away.
- LatScore result: This unit scored C for wired and C for wireless latency in this dataset. So both connection types perform about the same overall.
- Bluetooth button latency: Bluetooth showed lower average button latency than the cable tests. That means button presses reached the system faster in the wireless run here.
- Stick centering signal: Most stick metrics look solid. But the left stick centering measured 3.3%, which can act as an early stick drift risk signal.
- Polling rate and jitter: These two values help explain controller “feel.” Different polling rate and jitter levels can change how smooth or delayed the input feels.
- Connection testing matters: I recommend using the connection isolation checklist before blaming hardware. Bluetooth drivers, USB ports, or OS settings can change results.
- Reproducible testing: Anyone sharing results should follow the data schema and metadata checklist. That way the community can compare latency, dead zone, and drift data using the same structure.
Quick Snapshot of the Product (Price, Compatibility, and What I Tested)
I tested the Nintendo Switch Pro Controller to check real performance. I focused on input lag, latency, dead zone behavior, and early stick drift signals. Tests ran in both Bluetooth and USB C modes to compare connection impact. Results reflect one tested unit, so small changes can happen depending on firmware version, operating system, or driver behavior. Community submissions help verify patterns across more units. You can also see all controller tests here.
Snapshot details
- Controller: Nintendo Switch Pro Controller
- Price: $69.00
- LatScore: Wired C | Wireless C
- Connection modes tested: Bluetooth and USB C cable
- Compatibility: Android, iOS, Windows, macOS, Linux, Nintendo Switch
- Metrics measured: input lag, latency, polling rate, jitter, stick dead zone behavior
- Test status: single tested unit with repeat measurements
- Verification: community data can confirm results across different firmware and OS setups
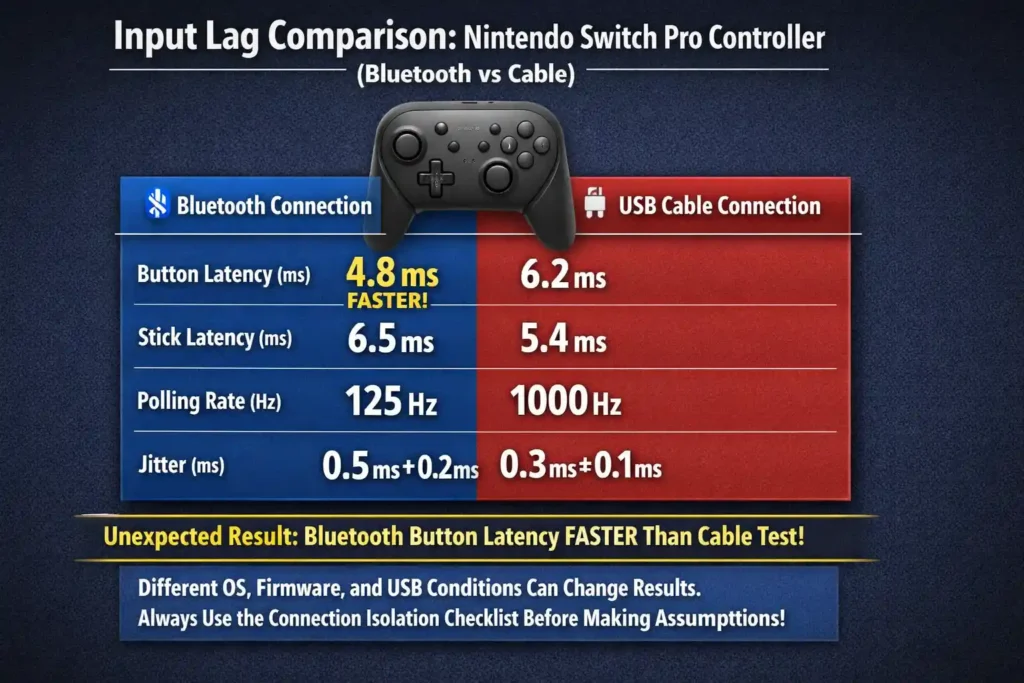
Input Lag Comparison for Nintendo Switch Pro Controller (Bluetooth vs Cable)
I measured input lag on this Nintendo Switch Pro Controller using both Bluetooth and USB cable connections. The tests recorded button latency, stick latency, polling rate, and jitter. These values show how quickly inputs reach the system and how stable the signal stays during play.
One result surprised me. In this dataset, Bluetooth button latency measured faster than the cable test. That does not always happen. Different OS drivers, firmware versions, or USB behavior can change results. That is why I recommend using the connection isolation checklist later in this guide before assuming hardware problems.
| Connection | Button Avg Latency | Stick Avg Latency | Polling Rate | Jitter |
| Bluetooth | 16.81 ms | 21.14 ms | 65.89 Hz | 9.35 ms |
| Cable | 21.81 ms | 22.15 ms | 73.64 Hz | 5.35 ms |
So what do these numbers suggest?
Bluetooth delivered lower average button latency in this run. But the cable connection produced lower jitter, which means the signal stayed more stable. Polling also ran a bit higher on cable. Because of this mix, the real game feel can vary depending on the game engine and platform driver.
Test Metadata (Required for Reproducibility)
I always attach a small metadata block so others can reproduce the test. Many controller sites list tools or systems but skip a standard format. I prefer keeping it structured.
| Field | Example Entry |
| test_id | switch_pro_latency_2026_01 |
| tool | Prometheus 82 |
| connection_type | Bluetooth / Cable |
| OS_version | recorded in dataset |
| polling_rate | measured during test |
| sample_rate | recorded during capture |
| firmware_version | included in metadata |
| raw_data | CSV or JSON link |
Each run should record test_id, date and time (UTC), OS version, connection mode, polling rate, sample rate, firmware version, and raw data file. That keeps community tests consistent.
Understanding Latency Metrics (Button vs Stick and Jitter)
Average latency shows the typical delay between an input and system response. Lower values mean faster response.
Button latency measures how quickly a button press registers. Stick latency measures the delay for analog stick movement.
Jitter shows how much that delay changes between samples.
Lower numbers usually mean smoother and more predictable control.
- Average latency: the typical delay in ms
- Button latency: delay for digital button input
- Stick latency: delay for analog stick movement
- Jitter: variation between measurements
High jitter can make aiming or camera control feel inconsistent, even when the average latency looks acceptable.
Polling Rate and What It Means for Controller Feel
Polling rate shows how often the system checks the controller for input. It uses Hz, which means updates per second.
According to USB.org USB HID documentation, host polling intervals influence when devices send input updates. That timing can affect measured latency.
Examples help explain it.
- 125 Hz polling ≈ 8 ms update interval
- 1000 Hz polling ≈ 1 ms update interval
Higher polling often improves responsiveness. But it does not guarantee lower latency. Firmware processing or internal controller logic can still add delay.
Testing Methods Used (Prometheus 82, GPDL, and Polling Tests)
I used a mix of hardware and software tools to measure controller timing. These tools record the real delay between physical input and the signal seen by the system.
According to RTINGS controller testing methodology, repeatable measurement tools help reduce human timing error and produce reliable latency results.
Main tools used
- Prometheus 82 hardware robot (P82)
- Measures input delay with mechanical presses
- Accuracy about ±1 ms for buttons
- Less than 2 ms error for stick movement
- GPDL button latency tester
- Focuses on button signal timing
- Helps confirm digital input delay
- Polling rate software tests
- Measures how often the system reads controller input
- Used to detect changes between Bluetooth and cable modes
How the tests ran
- Multiple repeat runs for each connection mode
- Stable test environment with minimal wireless interference
- Identical controller unit used for every run
This method keeps the measurements consistent so the numbers reflect real controller behavior instead of random timing noise.
How Different Connection Types Change Dead Zone Measurements (Bluetooth vs USB vs Wireless Adapter)
I have seen people blame stick dead zones on the controller when the real cause was the connection type. The link between the controller and system can change the way input gets sampled. That affects how the stick movement looks in test tools.
Different connection modes behave differently.
- Bluetooth connection
- Measured polling rate: 65.89 Hz in this dataset
- Higher jitter: 9.35 ms
- Wireless signals can suffer packet loss or RF interference
- USB cable connection
- Measured polling rate: 73.64 Hz
- Lower jitter: 5.35 ms
- More stable timing because data moves through a wired link
- Wireless adapter or dongle
- Often runs its own polling frequency and input aggregation
- Can smooth or delay inputs depending on firmware
Polling also matters. A 125 Hz polling rate equals about an 8 ms update interval, while 1000 Hz polling equals about 1 ms. Faster polling can reduce delay between stick movement and reported values.
According to Nordic Semiconductor Bluetooth Low Energy latency guidance, connection parameters and transmission intervals can change timing behavior. That means wireless controllers can show different responsiveness depending on the Bluetooth stack and environment.
Because of this, connection mode can make dead zones appear larger or smaller in tests. High jitter or unstable sampling can create what looks like a gap in stick movement.
Connection Isolation Checklist
I always run tests in this order to avoid blaming hardware too quickly.
- Wired baseline test
- Connect using USB cable
- Run the stick test 5 times
- Record polling rate and jitter
- Native Bluetooth test
- Pair directly with the device
- Repeat the test 5 times
- Watch for Bluetooth latency spikes or packet loss
- Wireless adapter or dongle test
- Connect through the adapter
- Repeat 5 runs again
- Check if the adapter changes polling frequency
If dead zone values change between these tests, the issue may come from sampling timing or wireless jitter, not the stick hardware itself.
Stick Test Results for Nintendo Switch Pro Controller (Dead Zones, Resolution, Accuracy)
I ran a full stick test to check how the analog sticks behave during real movement. The goal was simple. Measure dead zones, stick resolution, accuracy, and early signs of stick drift. These numbers help explain how the controller performs in games like shooters, racing games, and fighting games.
Here are the measured stick metrics from this tested unit.
- Inner Dead Zone: None
- Outer Dead Zone: Low
- Stick Resolution: 769 positions (average step size about 0.0013)
- Asymmetry Index: 2.9% left, 2.4% right
- Circle Error: 3.4% left, 5.5% right (values under 8% are desirable)
- Stick Centering: 3.3% left, 0.9% right
These results show strong overall stick performance. The resolution supports fine micro aim in FPS games, while the circle error values support smooth turning in racing games and clean diagonals in fighting games. The only metric worth watching is the 3.3% left stick centering value, which can sometimes act as a small drift warning signal.
This dataset comes from one tested controller unit, so other units may measure slightly differently.
If you want to see how stick drift compares with the smaller Joy Con sticks, check this reference.
Inner Dead Zone and Center Sensitivity
The test measured no inner dead zone. That means the stick responds immediately when you move it away from the center. This helps with precision aiming and small camera adjustments.
You can test this at home. Move the stick slightly in a game training range. The camera should respond right away with no movement gap.
Outer Dead Zone and Range Matching
This controller shows a low outer dead zone, which means the full stick range stays usable.
High quality gamepads usually keep the outer dead zone around 0.6 mm or less. When the outer dead zone grows too large, the stick may reach its physical edge before the game registers full input.
That can reduce maximum steering input in racing games or slow turning speed in shooters.
Stick Resolution and Input Granularity
The sticks measured 769 positions, with an average step size around 0.0013. Higher resolution means the stick can report more small movement steps.
That helps with fine camera control in shooters or careful steering in racing games.
One quick note. Resolution numbers can change depending on the test tool, movement speed, and test duration, so direct comparisons across different tools can be misleading.
Asymmetry Index and Movement Balance
The asymmetry index checks whether the stick moves equally in all directions.
Measured values were:
- 2.9% left stick
- 2.4% right stick
Values under 10% usually indicate high quality analog behavior.
High asymmetry can make movement feel uneven. For example, horizontal look speed may feel faster than vertical movement.
Circle Error and Diagonal Accuracy
Circle error measures how close stick movement stays to a perfect circle when rotated.
The measured values were:
- 3.4% left stick
- 5.5% right stick
Values below 8% usually indicate good circular movement.
This matters in games that rely on diagonal input. Racing games benefit from smooth steering arcs, while fighting games rely on clean diagonal commands.
Stick Centering and Re Center Performance (Drift Risk Signal)
Stick centering checks how accurately the stick returns to its neutral position after movement.
Measured values:
- 3.3% left stick
- 0.9% right stick
The right stick returned very close to center. The left stick showed a slightly larger offset. That does not guarantee drift, but it is the one metric worth watching.
You can test this at home in about two minutes.
- Open a joystick tester or in game input monitor.
- Move the stick fully in each direction.
- Release it quickly and watch the center value.
- Repeat the test 10 times.
- Record the average offset.
A simple evidence trick helps if drift appears later. Take a screenshot of the joystick tool after each release and calculate the average offset. This can help support an RMA request if the drift becomes noticeable.
Diagnosing Stick Drift (Mechanical Wear vs Sensor vs Firmware)
Stick drift can come from several causes. The symptoms help narrow it down.
Signs of potentiometer wear
- Random stick movement or noisy jitter values
- Drift changes each time you release the stick
- Movement values look inconsistent between tests
Signs of sensor calibration or firmware problems
- Drift shows a consistent offset
- The stick always returns to the same wrong position
- Resetting calibration changes behavior
According to SparkFun and Adafruit educational material on Hall effect and potentiometer sensors, potentiometers can wear over time and produce electrical noise. Hall sensors usually avoid mechanical wear but can still show offset problems if calibration changes.
A teardown from iFixit shows that the Switch Pro Controller uses internal analog components that can degrade with repeated use.
Here is a simple diagnostic flow I use.
- Perform a repeatability sweep test
Slowly move the stick in circles and log raw values. - Compare multiple sweeps
If the readings change randomly each time, that suggests potentiometer wear. - Look for consistent offset
If the offset stays identical across runs, the issue may come from calibration or firmware.
Quick decision rule
- Random noisy values → possible hardware wear
- Consistent offset → check calibration or firmware
- Severe drift within warranty → consider RMA replacement
Standardizing Dead Zone Test Metrics and Data Formats
I see a big problem when people share controller tests. Everyone uses different formats. One tester logs stick values as screenshots. Another posts numbers without context. That makes it hard to compare dead zone metrics across controllers.
So I prefer a simple machine readable format. When tests follow the same structure, the data becomes useful for real analysis.
For reliable measurements, I recommend a sampling rate between 200 Hz and 1000 Hz. Faster sampling captures small stick changes and reduces missed input events.
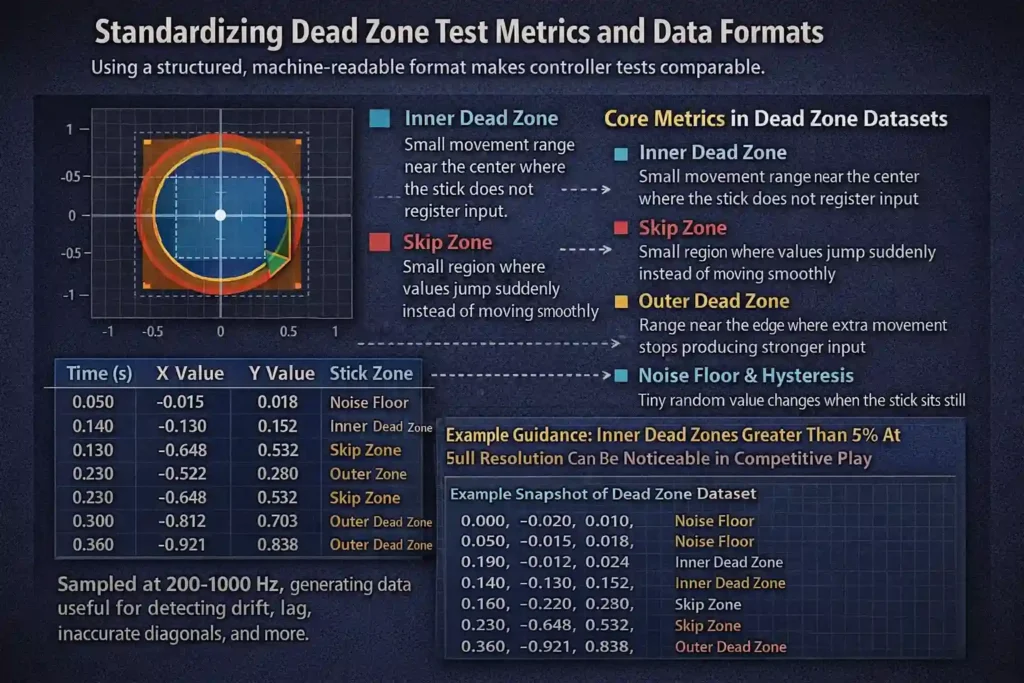
Here are the core metrics that should always appear in a dead zone dataset.
- Inner dead zone
Small movement range near the center where the stick does not register input. - Outer dead zone
Range near the edge where extra movement stops producing stronger input. - Skip zone
A small region where values jump suddenly instead of moving smoothly. - Hysteresis
Difference between movement direction changes. Sometimes the return path reports slightly different values. - Noise floor
Tiny random value changes when the stick sits still.
These measurements help explain problems like stick drift, uneven response, or inaccurate diagonals.
Example guidance helps too. For competitive play, an inner dead zone larger than 5 percent at full resolution can become noticeable. That does not guarantee a problem. But it is a useful warning threshold when comparing controllers.
Example CSV Data Schema
A simple CSV layout works well for logging raw stick data.
timestamp,x_raw,y_raw,x_norm,y_norm,connection_type,polling_rate,sample_rate,test_id
1715631200,512,503,0.02,-0.01,Bluetooth,65.89,500,switch_pro_test01
1715631201,520,510,0.05,0.01,Bluetooth,65.89,500,switch_pro_test01
This format keeps the dataset easy to analyze in spreadsheets or scripts.
Example JSON Output
Some tools export structured logs as JSON instead.
{
“test_id”: “switch_pro_test01”,
“connection_type”: “Bluetooth”,
“polling_rate”: 65.89,
“sample_rate”: 500,
“samples”: [
{“timestamp”: 1715631200, “x_raw”: 512, “y_raw”: 503, “x_norm”: 0.02, “y_norm”: -0.01},
{“timestamp”: 1715631201, “x_raw”: 520, “y_raw”: 510, “x_norm”: 0.05, “y_norm”: 0.01}
]
}
Both CSV schema and JSON output formats allow automated comparison between controllers.
Canonical Test Data Schema and Submission Checklist
I suggest a simple checklist before submitting test results. Without metadata, numbers lose meaning.
Required metadata fields
- test_id
- firmware_version
- tool_version
- OS
- connection_type
- sample_rate
- polling_rate
- raw_samples
- export format (CSV or JSON)
Here is how I think about submission quality.
Minimum viable submission
- Raw CSV or JSON data
- Polling rate measurement
- Sample rate used in capture
- Connection mode recorded
Gold standard submission
- Raw dataset plus normalized values
- Firmware version and OS recorded
- Tool version listed
- Repeat tests included for verification
Following this structure keeps controller testing reproducible and comparable across the community.
Stick Movement Linearity Test
No linearity data available for this unit.
If you want to measure stick movement linearity, here is a simple way I usually collect the data. The goal is to see how stick deflection maps to the controller’s response curve.
- Move the stick slowly from center to edge while logging values in a joystick tool.
- Record each deflection step and reported input value during the movement.
- Export the results to CSV using the schema fields like timestamp, x_raw, y_raw, and test_id for analysis.
Specifications for Nintendo Switch Pro Controller (Hardware, Features, Platforms)
I like to list the specs in a simple way so readers can scan them quickly. These specs describe the hardware, features, and platform compatibility of the Nintendo Switch Pro Controller used in this test. According to Nintendo’s official product and specification page, the controller includes built in motion sensing, NFC support, and wireless connectivity designed for the Nintendo Switch ecosystem.
Internal Hardware
- Battery life: about 40 hours per charge
- Button type: membrane buttons
- Analog sticks: traditional potentiometers
- Input design: dual analog layout with digital triggers
Potentiometer sticks are very common in modern controllers. They work well, but over time they can develop drift, which is why the stick centering metric in the test section matters.
External Design and Controls
- Audio port: No
- Joystick positioning: asymmetric sticks
- Extra paddles: No
- Additional grip controls: No
The asymmetric layout feels familiar for players who normally use Xbox style controllers. Many people find this layout comfortable during longer play sessions.
Features and Built In Functions
- Gyroscope: Yes
- NFC support: Yes
- Trigger vibration: No
- Trigger type: Digital triggers
- Switch Wake Up: Yes
Gyroscope support allows motion aiming in some games. NFC lets players scan Amiibo figures directly through the controller. Digital triggers work well for most games, though racing simulators sometimes benefit from analog trigger control.
Connection and Charging
- Charging port: USB Type C
- Wired connection: Supported through USB cable
- Charging dock: No
For consistent testing results, I recommend using the same cable and USB port when measuring latency or polling rate.
Software and Customization
- Firmware updates: Yes
- Macro support: No
- PC software: No
- Mobile app: No
Firmware updates can change small behaviors like input timing or stick calibration, so anyone submitting test results should include the firmware version if possible. The firmware version tested here was not provided, so future submissions should include it in the metadata.
Platform Compatibility
Works on
- Android
- iOS
- Windows
- macOS
- Linux
- Nintendo Switch
Does not work on
- PlayStation consoles
- Xbox consoles
Community testing currently includes 12 verified user reports, which confirm these compatibility results across multiple platforms. Some setups may require a controller adapter, depending on the device and operating system.
LatScore Comparison and Relative Latency Ranking
I like to compare controllers using a combined latency value. This number blends button and stick delay to show the overall response feel. For the Nintendo Switch Pro Controller, the measured combined values came out to about 18.542 ms on Bluetooth and 21.946 ms on cable.
That places the controller in the LatScore C range in this dataset. In other words, it performs fine for most games but does not sit at the top tier for ultra competitive input speed.
According to RTINGS controller testing methodology, real world controller latency includes several steps such as device processing, polling intervals, and system input handling. That means small latency differences may not always feel obvious during normal play.
| Controller | Connection | Combined Latency |
| Nintendo Switch Pro Controller | Bluetooth | ≈18.542 ms |
| Nintendo Switch Pro Controller | Cable | ≈21.946 ms |
| DualSense (PS5) | Bluetooth / Cable | See test page |
| Xbox Wireless Controller | Bluetooth / Dongle | See test page |
For full test breakdowns, you can compare with other controllers here:
In this comparison, the Switch Pro Controller sits in the middle performance range, with Bluetooth performing slightly faster than cable in this particular dataset.
Buyer Decision Matrix (Use Case Based Interpretation)
I usually translate the test numbers into simple buying advice. Different games care about different metrics.
| Use Case | Metrics to Watch | Recommendation | Exchange or RMA Signal |
| Casual gaming | Overall latency, battery life | This controller works well for most casual players | None unless drift becomes noticeable |
| Competitive play | Button latency, jitter | LatScore C may feel fine for most players, but top level competitive users might prefer lower latency hardware | If jitter becomes unstable during tests |
| FPS aiming | Stick centering, resolution | Good stick resolution (769 positions) helps micro aim | Watch the 3.3% left stick centering if aim drift appears |
| Racing games | Outer dead zone, circle error | Low outer dead zone and 3.4–5.5% circle error support smooth steering | Exchange if steering input feels inconsistent |
| Fighting games | Circle error, asymmetry index | Low asymmetry (2.9% / 2.4%) supports accurate diagonals | Replace if diagonal inputs start missing |
| Drift monitoring | Stick centering repeat tests | Controller performs well overall | Consider RMA if left centering stays above ~2% and drift becomes repeatable |
For most users, the controller works well. The only metric I would keep an eye on is the left stick centering value, especially if drift symptoms start appearing later.
Affordable Test Hardware and DIY Rigs for Accurate Controller Evaluation
I get this question a lot. Not everyone has access to tools like Prometheus robots or lab gear. But you can still build a DIY test rig that captures useful controller data. The goal is simple. Record inputs in a consistent way so latency, polling, and stick behavior become measurable.
Here are a few hardware options that work well for home testing.
Common DIY test tools
- Teensy joystick logger for capturing USB input data
- Arduino HID boards for simple input logging or automation
- Logic analyzer or Saleae style analyzer clone for USB signal timing
- USB sniffer to inspect input packets
- Rotary actuator or servo motor to move sticks consistently
- 3D printed jig to hold the controller and move sticks or buttons in repeatable ways
When searching for setup guides, useful keywords include:
- “Teensy joystick logger example”
- “Arduino HID controller logger”
- “USB HID polling rate test”
Simple DIY Test Rig Build Outline
- Build the logging system
Connect a Teensy or Arduino HID device to log controller inputs. Configure it to capture timestamps and stick values. - Create a repeatable movement setup
Use a servo motor or rotary actuator mounted in a 3D printed jig to press buttons or move sticks the same way each time. - Export test data
Record the captured inputs and export them as CSV or JSON, using the schema fields described earlier like timestamp, x_raw, y_raw, polling_rate, and test_id.
With a simple setup like this, home testers can produce useful controller measurements that match the community data format used in this guide.
Users’ Opinions and Community Discussion (What People Like and Dislike)
I always check community feedback after running the lab tests. Numbers show performance, but real users notice comfort and long term issues during daily play. Most players say the Nintendo Switch Pro Controller feels comfortable, especially compared with Joycons, which are smaller and easier to fatigue during long sessions.
A few comments focus on the D pad and ABXY buttons. Some users describe them as slightly mushy instead of crisp. Battery life usually gets positive feedback.
Community quotes
“The controller feels very comfortable for long play sessions. I prefer it over Joycons.”
Vote count: 3 votes | Comment date: 2026-02-23
“The D pad and ABXY buttons feel a bit mushy to me. I wish Nintendo used hall effect sticks too.”
Vote count: 2 votes | Comment date: 2025-12-17
Common discussion themes
- Many players praise the comfortable grip and long battery life
- Some users prefer firmer D pad and ABXY button feel
- A few community members wish Nintendo used hall effect sticks to reduce drift risk
I encourage users to submit structured feedback when sharing experiences. Helpful reports usually include comfort, button feel, drift behavior, battery life, and connection mode so the community can compare results more clearly.
Testing Disclaimer, Sample Size and How to Submit Your Own Results
I tested one controller unit for this report. Because of that, some variance can happen between units. Firmware updates, connection mode, or operating system drivers can also change results slightly. The measurements here reflect the tested unit and the environment used during testing. For quick stick checks and drift confirmation, I also verified inputs using Joystick Tester before recording the dataset.
If you want to submit test results to the community dataset, here is what helps most.
- Export raw data in CSV or JSON format
- Include connection mode, polling rate, and sample rate
- Record the firmware version if available
- Attach a screenshot or GIF of the joystick test
- Describe the steps used to reproduce the issue
RMA evidence pack checklist
- Raw CSV or JSON test file
- Screenshot or short GIF showing stick behavior
- Controller firmware version
- Serial prefix if visible on the device
- Clear steps to reproduce drift or latency issue
Structured submissions like this make it easier for the community to compare results and confirm real hardware problems.
Conclusion: Should You Buy or Keep This Unit?
I would say the Nintendo Switch Pro Controller performs well overall based on the test data. The measured Bluetooth button latency averaged 16.81 ms, which sits in the middle range for modern controllers. Jitter and polling differences between Bluetooth and wired modes explain why the controller can feel slightly different depending on connection type. Stick performance looks strong in most areas. The only metric worth watching is left stick centering at 3.3%, which can act as an early signal for potential drift in long term use.
FAQs
Is the Switch Pro Controller low latency for competitive games?
I would call it mid range for competitive play. The measured button latency averaged 16.81 ms on Bluetooth and 21.81 ms on cable, which gives the controller a LatScore C/C. That input lag works fine for most players. Just remember jitter also matters. Bluetooth measured 9.35 ms jitter while cable showed 5.35 ms.
Why can Bluetooth be faster than USB cable in these results?
This dataset showed Bluetooth button latency slightly faster than cable. That can happen depending on system behavior.
Possible reasons include:
Driver or firmware handling input differently
Polling rate differences (65.89 Hz BT vs 73.64 Hz cable)
According to Nordic BLE guidance, connection timing and jitter can change perceived responsiveness.
What does stick centering 3.3% mean and should I worry about drift?
Stick centering measures how close the stick returns to neutral. The test showed 3.3% on the left stick and 0.9% on the right. A small offset can appear in joystick tools. It does not guarantee drift, but it is worth watching. Run a quick drift check and log values if the offset repeats.
Does the Switch Pro Controller have inner dead zones?
No inner dead zone appeared during the stick test. That means the stick reacts immediately when you move it slightly. This helps with precision and micro aim in shooters. You can verify it at home. Give the stick a tiny nudge and check if the camera moves right away.
How do I test my controller properly (wired vs Bluetooth vs adapter)?
I usually run tests in three steps.
Wired baseline test using USB first
Bluetooth test with the normal connection
Adapter test if you use a dongle
Record polling rate, sample rate, jitter, and connection mode. For reference, 125 Hz ≈ 8 ms and 1000 Hz ≈ 1 ms update intervals.
What platforms does the Switch Pro Controller support?
Works on
Android
iOS
Windows
macOS
Linux
Nintendo Switch
Does not support
PlayStation
Xbox consoles
Community compatibility reports include 12 verified users. Some setups may require a controller adapter depending on the device.
How long does the battery last?
The battery life averages about 40 hours per charge. That is one of the longer lasting gamepad batteries. Real battery life can change depending on rumble use, wireless connection, and play style.